
Massachusetts' latest weekly data on the coronavirus pandemic, including the updated community-level risk assessment map, shows a slight reduction in the number of communities considered at the highest risk for transmitting COVID-19.
The data, from the Department of Public Health, includes a breakdown of the total number of coronavirus cases in each Massachusetts city and town, as well as the new map and data from testing at in-state colleges and universities.
Mass. Coronavirus Risk Map
The high-risk communities in Wednesday's report are Chelsea, Everett, Framingham, Holliston, Lawrence, Lynn, Marlborough, Nantucket, New Bedford, Revere, Saugus, Tyngsborough, Winthrop, Worcester and Wrentham.
Holliston and Marlborough were added to the list of communities in red since last week, while Dedham, Lynnfield, Monson and Plainville dropped off the list.
Cities and towns shaded red have the greatest risk levels. There are 15 in this map, a decrease of two from last week's map, which included data from Aug. 30-Sept. 12.
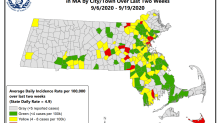
The map shows the number of cases detected on average each day over the last two weeks in each of Massachusetts' communities. More than 8 cases per 100,000 translates to a high risk, between 4 and 8 cases per 100,000 is moderate risk, and any less than that is low risk.
Boston missed being high risk by just 0.1 case per 100,000, following a warning from Mayor Marty Walsh Wednesday. It has 7.9 new cases per 100,000.
Recent Coronavirus Tests Returning Positive
Among cities and towns with at least 15 new cases in the last two weeks, these 25 communities have the highest percentages of positive cases:
| Community | Number of cases | Cases in the last 14 days | Average daily incidence rate per 100,000 in the last 14 days | Total tests in the last 14 days | Positive tests in the last 14 days |
| Lawrence | 4,538 | 273 | 22 | 5,980 | 5.87% |
| Revere | 2,582 | 154 | 18 | 4,636 | 4.31% |
| Lynn | 4,792 | 160 | 11 | 5,641 | 4.11% |
| Chelsea | 3,556 | 118 | 22 | 3,858 | 4.02% |
| New Bedford | 2,627 | 131 | 9 | 4,732 | 3.83% |
| Nantucket | 88 | 42 | 27 | 1,127 | 3.73% |
| Framingham | 2,203 | 130 | 13 | 4,426 | 3.32% |
| Everett | 2,227 | 81 | 12 | 3,512 | 2.96% |
| Fall River | 2,080 | 95 | 8 | 4,475 | 2.91% |
| Marlborough | 1,188 | 51 | 8 | 2,317 | 2.76% |
| Attleboro | 815 | 49 | 8 | 2,091 | 2.68% |
| Wrentham | 249 | 19 | 12 | 812 | 2.59% |
| Methuen | 1,262 | 59 | 8 | 3,237 | 2.41% |
| Brockton | 4,754 | 92 | 7 | 5,324 | 2.27% |
| Lowell | 3,339 | 129 | 8 | 6,785 | 2.24% |
| Saugus | 702 | 34 | 9 | 1,949 | 2.10% |
| Dracut | 537 | 27 | 6 | 1,653 | 1.88% |
| Milford | 743 | 20 | 5 | 1,392 | 1.80% |
| Woburn | 753 | 37 | 6 | 2,421 | 1.78% |
| Haverhill | 1,445 | 52 | 6 | 3,732 | 1.77% |
| Holliston | 93 | 16 | 8 | 922 | 1.74% |
| Chelmsford | 426 | 27 | 5 | 1,735 | 1.73% |
| Hingham | 333 | 25 | 8 | 1,570 | 1.72% |
| Norwood | 672 | 28 | 7 | 2,021 | 1.68% |
| Westford | 198 | 19 | 6 | 1,271 | 1.65% |
Data from between Sept. 2 and Sept. 16, 2020, omitting communities with under 15 new cases in that span.
Lawrence had the highest rate of positive tests among qualifying communities, with a slight increase from 5.27% last week to 5.32% this week. Chelsea had the second highest rate with 4.72%, an improvement from last week's rate of 5.35%. Everett came in third with 4.56% positive cases, an improvement from 5.16% last week.
The state's overall rate of positive tests has fluctuated, but it has been decreasing in each data set presented since early August, dropping to 0.85% positive tests in the last 14 days.
Of the group of highest-risk communities from the state's map, all but Tyngsborough, Winthrop and Worcester appear on the chart above. Tyngsborough, with its 14 cases, was excluded because it did not meet the threshold of 15 positive tests in the last two weeks, while Winthrop (13.7% positivity) and Worcester (0.86%) were not among the 25 communities with the highest rates of positive tests in that period.
Take a closer look at last week's list.