
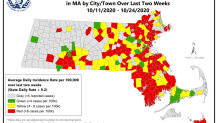
More than one-third of the cities and towns in Massachusetts now stand in the Department of Public Health's highest risk designation for COVID-19, while the statewide incidence rate increased again in the latest weekly report.
The state's color-coded system counts 121 municipalities in the red, representing an average daily incidence rate of 8 cases per 100,000 or higher over the past 14 days, in Thursday's update. That's an increase of 44 communities from last week.
DPH officials said they added 54 communities to the red this week: Agawam, Athol, Bedford, Bellingham, Beverly, Billerica, Blandford, Bolton, Braintree, Bridgewater, Brimfield, Cohasset, Danvers, Dartmouth, Dedham, Dighton, Dover, Dracut, East Bridgewater, Fitchburg, Foxborough, Freetown, Gardner, Georgetown, Granby, Hubbardston, Lakeville, Leominster, Littleton, Mansfield, Medford, Mendon, Nahant, Nantucket, Newburyport, North Attleborough, Northborough, Norton, Palmer, Peabody, Salisbury, Southborough, Swansea, Taunton, Tewksbury, Townsend, Wareham, West Boylston, West Springfield, Westborough, Westwood, Whitman, Wilmington, and Winchester.
Another 10 communities -- Mattapoisett, Middleborough, Millville, Milton, Monson, Oxford, Scituate, Somerville, Swampscott and West Newbury -- had been in the highest-risk category last week but were downgraded to a lower level with Thursday's update.
Based on the increase in case rates, 15 cities or towns that have consistently been in the red must revert to the first step of Phase 3 in the reopening plan starting Monday: Abington, Berkley, Canton, East Longmeadow, Fairhaven, Fall River, Hanover, Hanson, Hingham, Marshfield, Milford, Pembroke, Rockland, Wakefield and Weymouth.
In Phase 3, Step 2, they had been permitted to reopen indoor performance venues, resume many recreational activities, and expand outdoor gathering limits in public settings.
Read this week's full report here, with data on communities' percent positivity, county- and state-level data and more.
Nearly 3,000 COVID Clusters Detected in Mass.
The latest weekly report now includes data on individual clusters, helping track whether a community's accelerated spread is linked to a specific incident such as a party that prompted transmission. Communities where identified clusters resulted in more than 10 cases and at least 30% of the municipality's total cases over the past 14 days are marked with an asterisk.
Having an asterisk won't change whether a city or and town can move forward or backward in Massachusetts' reopening plan or if more people can gather together, according to the command center. The asterisk doesn't change the red or yellow status.
That data shows that 2,945 coronavirus clusters have been detected between Sept. 27 and Oct. 24. The vast majority have been associated with households and they've led to 8,208 confirmed cases.
The state defines clusters are at least two COVID-19 cases associated with one location, and it considers the information useful for learning where people are being infected.
Since Sept. 27, all but 238 of identified clusters were associated with households. Long-term care facilities have the next most clusters, 59.
State House News Service contributed to this report.