Health experts are expressing concern about the rising number of coronavirus cases in Massachusetts as more towns and cities enter the state's "red zone" of high-risk communities.
On Thursday, health officials added nearly two dozen communities to the list of high-risk towns, impacting their ability to participate in Phase 3, Step 2 of the state's reopening plan.
Here are five key numbers that illustrate the recent rise of COVID-19 cases in Massachusetts.
986: Highest number of cases since May
Massachusetts confirmed 986 new cases Thursday, the highest number of cases in a day so far this fall. The state also reported 30 new deaths.
Back on May 24, the Massachusetts Department of Public Health reported 1,013 cases in a single day, according to archived data on its website.
There have now been 9,589 confirmed deaths and 143,927 cases in Massachusetts, according to DPH.
77: Number of High Risk Communities
Massachusetts' latest weekly community-level data on the coronavirus pandemic, including the updated town-by-town risk assessment map, shows 77 communities considered at the highest risk for transmitting COVID-19, an increase of 14 from last week.
The following communities were in the highest risk level as of Wednesday: Abington, Acushnet, Ashland, Attleboro, Avon, Berkley, Boston, Boxford, Brockton, Buckland, Canton, Chelmsford*, Chelsea, Chicopee, Clinton, East Longmeadow, Everett, Fairhaven, Fall River, Framingham, Gloucester, Hanover, Hanson, Haverhill, Hingham, Holliston, Holyoke, Hudson, Kingston, Lawrence, Leicester, Lowell, Lynn, Lynnfield, Malden, Marlborough, Marshfield, Mattapoisett, Methuen, Middleborough, Middleton*, Milford, Millville, Milton*, Monson, New Bedford, North Andover*, Norwood, Oxford, Pembroke, Plymouth, Randolph, Raynham, Revere, Rochester, Rockland, Saugus, Scituate, Seekonk, Shrewsbury, Somerset, Somerville, Springfield, Swampscott, Tyngsborough, Wakefield, Waltham, Webster, West Bridgewater, West Newbury, Westfield, Westport, Weymouth, Winthrop, Woburn, Worcester, and Wrentham.
The asterisks, new in the state's revamped community-level coronavirus risk processing, mean that a local institution accounts for at least 11 cases in the community and those cases make up 30% or more of the community's total cases over the last two weeks.
These 23 communities are new to the list since last week: Ashland, Avon, Boxford, Buckland, Chicopee, Clinton, Gloucester, Lynnfield, Mattapoisett, Middleborough, Millville, Monson, Norwood, Raynham, Rochester, Scituate, Seekonk, Somerset, Swampscott, West Bridgewater, Westfield, Westport and Wrentham .
And Amherst, Auburn, Dartmouth, East Bridgewater, Holbrook, Littleton, Nantucket, Southborough and Sunderland have left the highest risk level since last week.
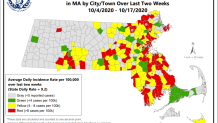
The map shows the number of cases detected on average each day over the last two weeks in each of Massachusetts' communities. More than 8 cases per 100,000 translates to a high risk and red shading, between 4 and 8 cases per 100,000 is moderate risk and any less than that is low risk.
The state's average itself entered the red zone last week, with the average incidence rate climbing to 8.7 cases per 100,000 people. This week the rate was up to 9.2.
1.4: Percentage of tests coming back positive
The seven-day weighted average of positive molecular tests -- which measures the rate of positive coronavirus tests -- rose to 1.4%, according to Thursday's report.
That rate has hovered at 1.3% this month, but has risen steadily in recent weeks. On Sept. 20, that rate stood at 0.8%
202: Number of students, school staff to test positive
Massachusetts health officials on Thursday announced that 129 students and 73 staff members had tested positive for the coronavirus over the past week, an increase over the previous week.
The cases were reported to the Department of Elementary and Secondary Education between Oct. 15 and Oct. 21, and include students who have participated in in-person or hybrid learning at 72 school districts, collaboratives and special education schools.
There have now been a total of 388 cases in students and 233 in staff dating back to Sept. 24. No districts reported more than six cases in the last week.
4: Number of hospitals using surge capacity
The number of hospitals using surge capacity jumped from two to four in Thursday's report. That number rose from the zero hospitals reported Sunday.
However, Gov. Charlie Baker also pointed out last week that the state now has the infrastructure in place to withstand a surge in cases, with hundreds of hospital beds at the ready and field hospitals available for activation if needed.
He noted that the state's testing and contact tracing capacity is also far greater now than it was six months ago.
"We are in a very different position with respect to our ability to test and trace and isolate quarantine, and we have far better data that we can make available to our communities and to our health care system than we could last spring, and we've done a lot of work in particular, with the health care community and the long-term care community, to sort of make them far more robust with respect to their ability to deal with whatever might come," Baker said. "I think it's important to remember that we are not where we were in March."